Work
Data Visualization, Information Hierarchy
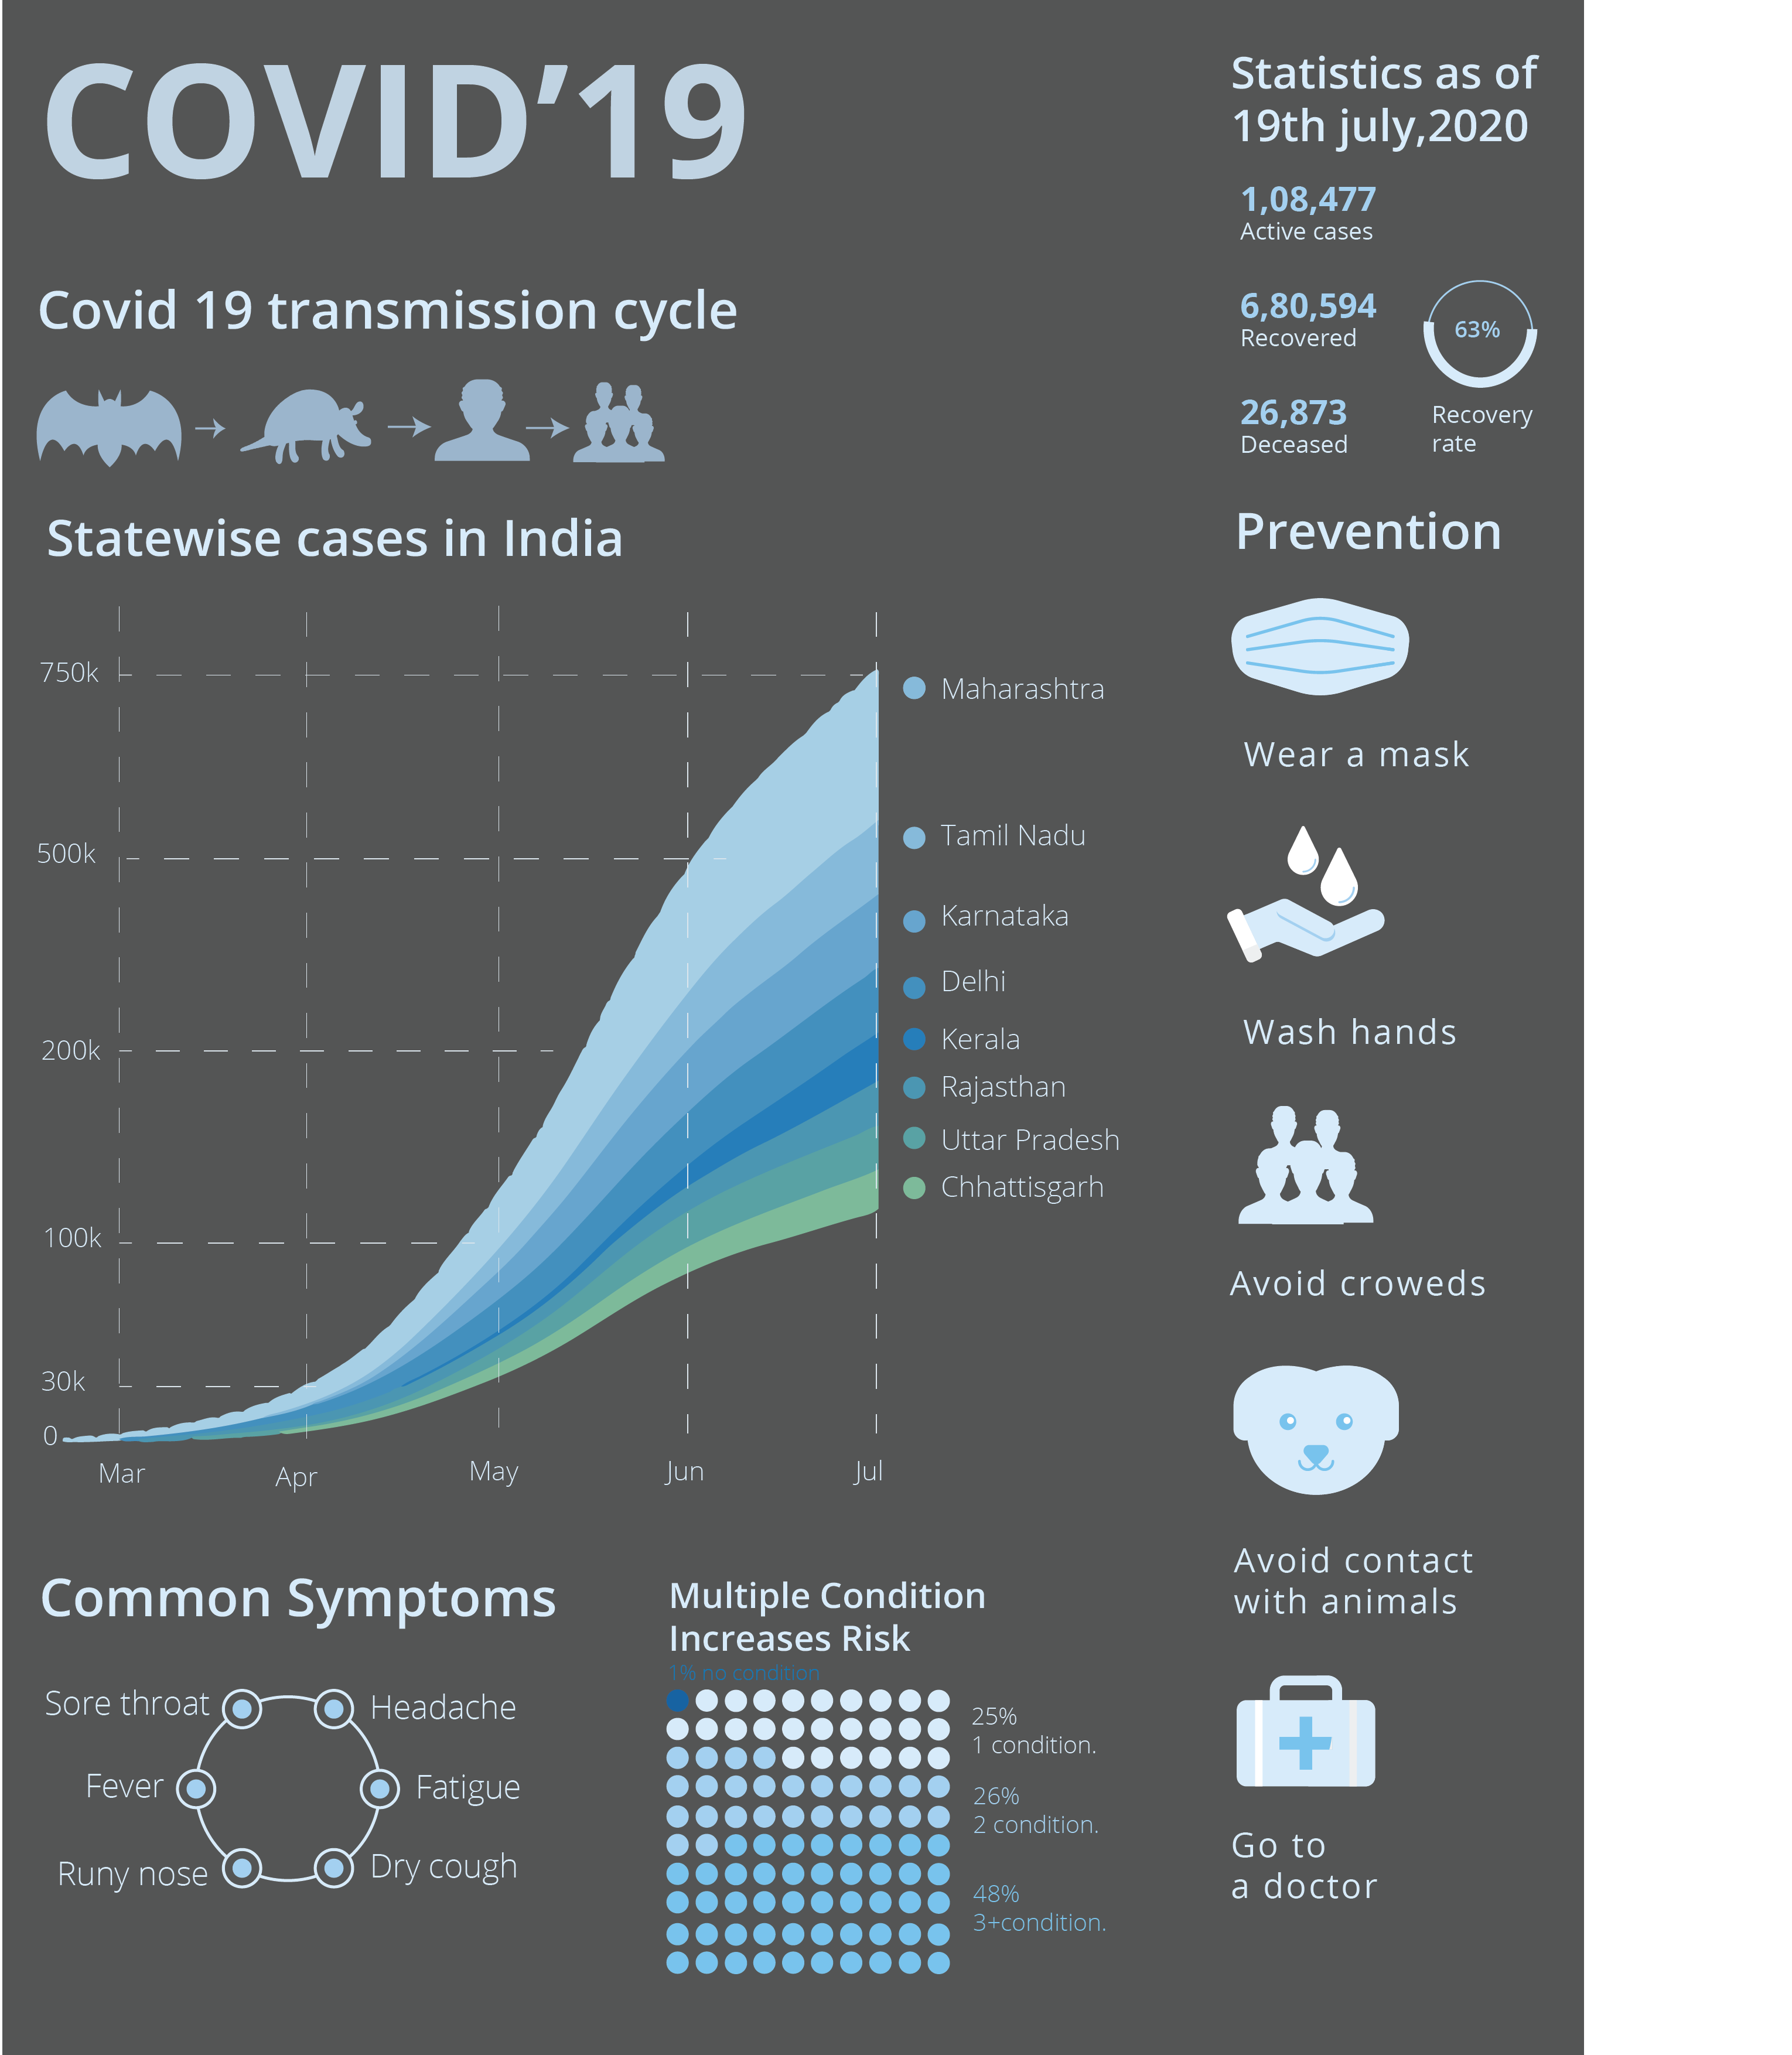
To create an Infographics poster highlighting :
1. How the disease is transmitted
2. Active cases, deceased, recovered in different states of India
3. that an individual (layman) must take/follow
4. Common symptoms
The poster should be easily and clearly understood and remembered by the general public.
.png)